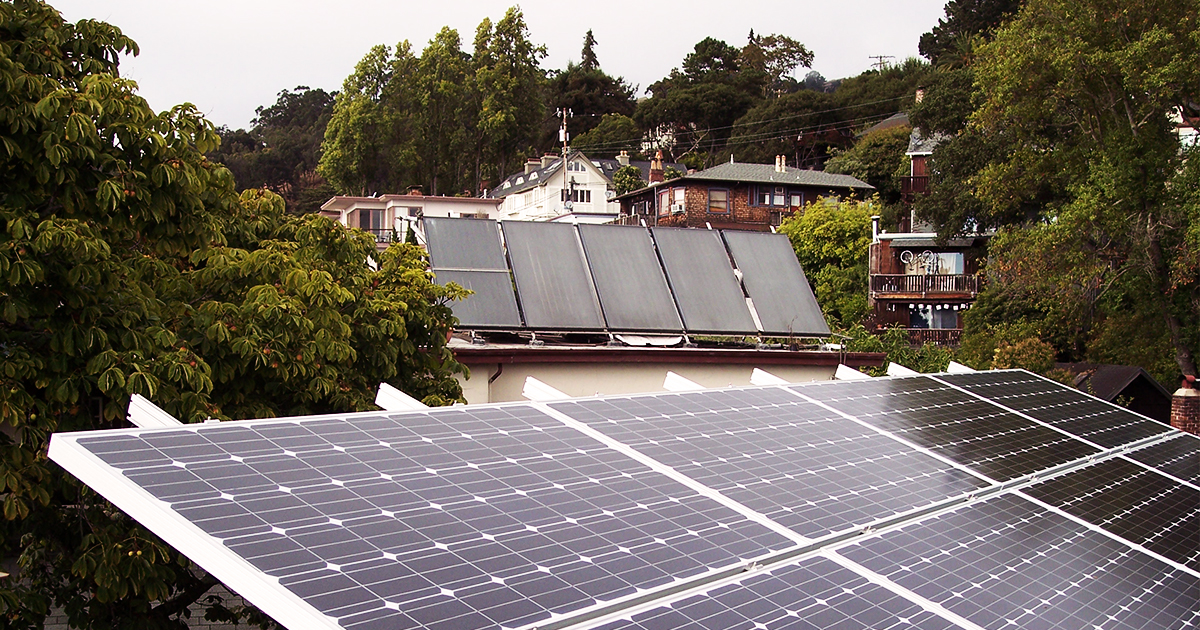
Google made major headlines in the clean energy world last week when it unveiled new findings from Project Sunroof, an initiative that combines data from Google Maps and Google Earth with 3-D modeling and machine learning to determine rooftop solar potential. Google’s analysis had initially been limited to selected cities, but last week it presented new findings from an expanded analysis of solar potential across all 50 states.
The top-line findings were striking: Project Sunroof estimates that 79% of all homes have rooftops that are technically viable for solar, meaning they have adequate roof space and receive sufficient sunlight for an installation. This viability varies widely between regions, with sunny states in the southwest and Hawaii receiving enough insolation for about 90% of homes, compared to 60% of homes in northern states like Maine and Minnesota. There are also interesting city-level findings — for instance, the city with the greatest rooftop solar potential is Houston, the heart of the oil industry!
Of course, due largely to the lack of a statewide net metering policy, there’s currently hardly any rooftop solar in Houston, which feeds into the biggest criticism of the study: does it really matter that 79% of homes are “viable” for solar if so many of these homes are located in areas where solar isn’t economically viable due to policy constraints and other factors? And how many households realistically have the financial means to go solar — which, despite steadily-falling costs, is still a major investment?
Sketching Out an Economic Viability Analysis
So, while Google’s analysis is a great conversation starter, it would be useful to have a more practical sense of how much solar might be both technically and economically viable under current market conditions. To develop this kind of back-of-the-envelope estimate, let’s use findings of an analysis by GTM Research from February 2016 that looked at which states were at “grid parity” for solar — defined by GTM as states where “the levelized cost of solar falls below electricity bill savings in the first year of a solar PV system’s life,” taking into account utility and state-specific rate design, system production, and installation costs.
According to this definition, GTM found that there are 20 U.S. states where solar is already at grid parity — or, rather, were at grid parity at the start of 2016. For the sake of making some conservative updates to GTM’s analysis, let’s take California, Hawaii, and Arizona off the list, since new rates being implemented in these states have complicated solar economics to varying degrees — although the time-of-use (TOU) rates being phased in will create an intriguing value proposition for battery storage, an emerging market that we’re really excited and optimistic about going forward.
(In fact, we’re already offering solar + storage financing packages in California and Hawaii!)
On the plus side of the ledger, let’s add Pennsylvania, which was right on the edge of grid parity at the start of 2016 and has since become one of the fastest-growing markets in the country while embarking on a major new initiative called Finding Pennsylvania’s Solar Future. Let’s also add Illinois, a previously-borderline state that passed a Future Energy Jobs Bill in December that was hailed by NRDC as “the most significant piece of climate and clean energy legislation in the state’s history.” The bill included a revamped Renewable Portfolio Standard (RPS) with a carveout for small-scale solar installations, which is expected to provide a huge boost for that state’s residential solar industry.
There are other noteworthy updates we could make — for instance, while the lack of a statewide net metering policy hampers Texas home solar, the state is emerging as a major growth market due to the lowest solar costs in the country along with local pro-solar policies such as net metering and rebates in cities including Austin and San Antonio. We’re also likely to see more states crossing into the grid parity column this year, and overall GTM projected that 42 states will be at grid parity by 2020.
But, to keep this estimate relatively conservative, let’s keep the list at those 19 states that are already or imminently going to be at grid parity for residential solar without having to get into TOU rates, battery storage, or other potential complications.
State-By-State Solar Potential
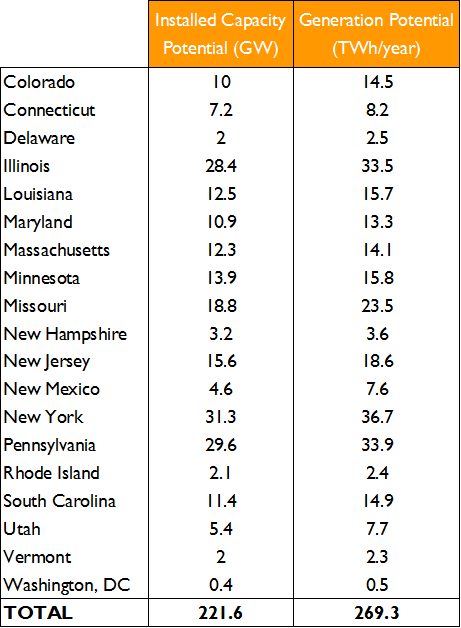
Having focused our analysis a bit, we can now cross-reference this list of states with estimates of U.S. rooftop solar technical potential carried out by the National Renewable Energy Laboratory at the start of 2016. Much like Project Sunroof, this study generated eye-catching headlines — and skeptical pushback — with its finding that the U.S. could generate nearly 40% of its total electricity demand from 1,118 gigawatts (GW) of technically feasible rooftop solar installations.
The study uses a different methodology than the Project Sunroof analysis, drawing on LIDAR (Light Detection and Ranging) and GIS (Geographic Information System) data as well as more detailed PV modeling. Most importantly for our purposes, it has the notable virtues of providing a state-by-state breakdown of rooftop solar potential in terms of capacity and annual generation, as well as a breakdown in terms of large, medium, and small buildings. We’ll use small buildings as a proxy for residential solar potential, although this may include smaller commercial buildings as well.
When you add it all up, you’re looking at 221.6 GW of potential solar installations on homes and other small buildings, in states where it generally makes economic sense to go solar today — and that doesn’t even include California. It’s less than a fifth of the overall technical potential from all rooftops — but it would still be enough to generate nearly 20% of total U.S. residential electricity use in 2016. And, considering the residential solar industry set a new record with “only” 2.5 GW installed in 2016, it’s a truly massive number in terms of the solar industry’s near-term growth potential.
Time to Think Big?
When 221.6 GW of near-term rooftop solar potential can be considered a “conservative” estimate, you know you’re talking about a seriously massive market opportunity. And, while it’s probably unrealistic for all of this potential to be realized any time soon, there’s no technical or economic barriers to doubling, tripling, or quadrupling the 2.5 GW of residential solar installed in 2016 — and no reason for our industry to settle for anything less in setting our goals.
The only missing piece of the puzzle for many homeowners is getting the financing needed to overcome the up-front costs of going solar, which can make those first-year savings a reality from the very first month. That’s why we are working obsessively with our installer partners to continue to streamline and scale our home solar financing platform — we’ve already originated our first $1 billion in home solar loans, but there is so, so, so much more work to do.
Our vision has always been a 100% clean energy economy that helps all Americans prosper, and we think we can get there sooner than a lot of people think.
See if we can help you join the movement